Data Pipeline and Methodology
Daily basin snow water equivalent (SWE) prediction pipeline
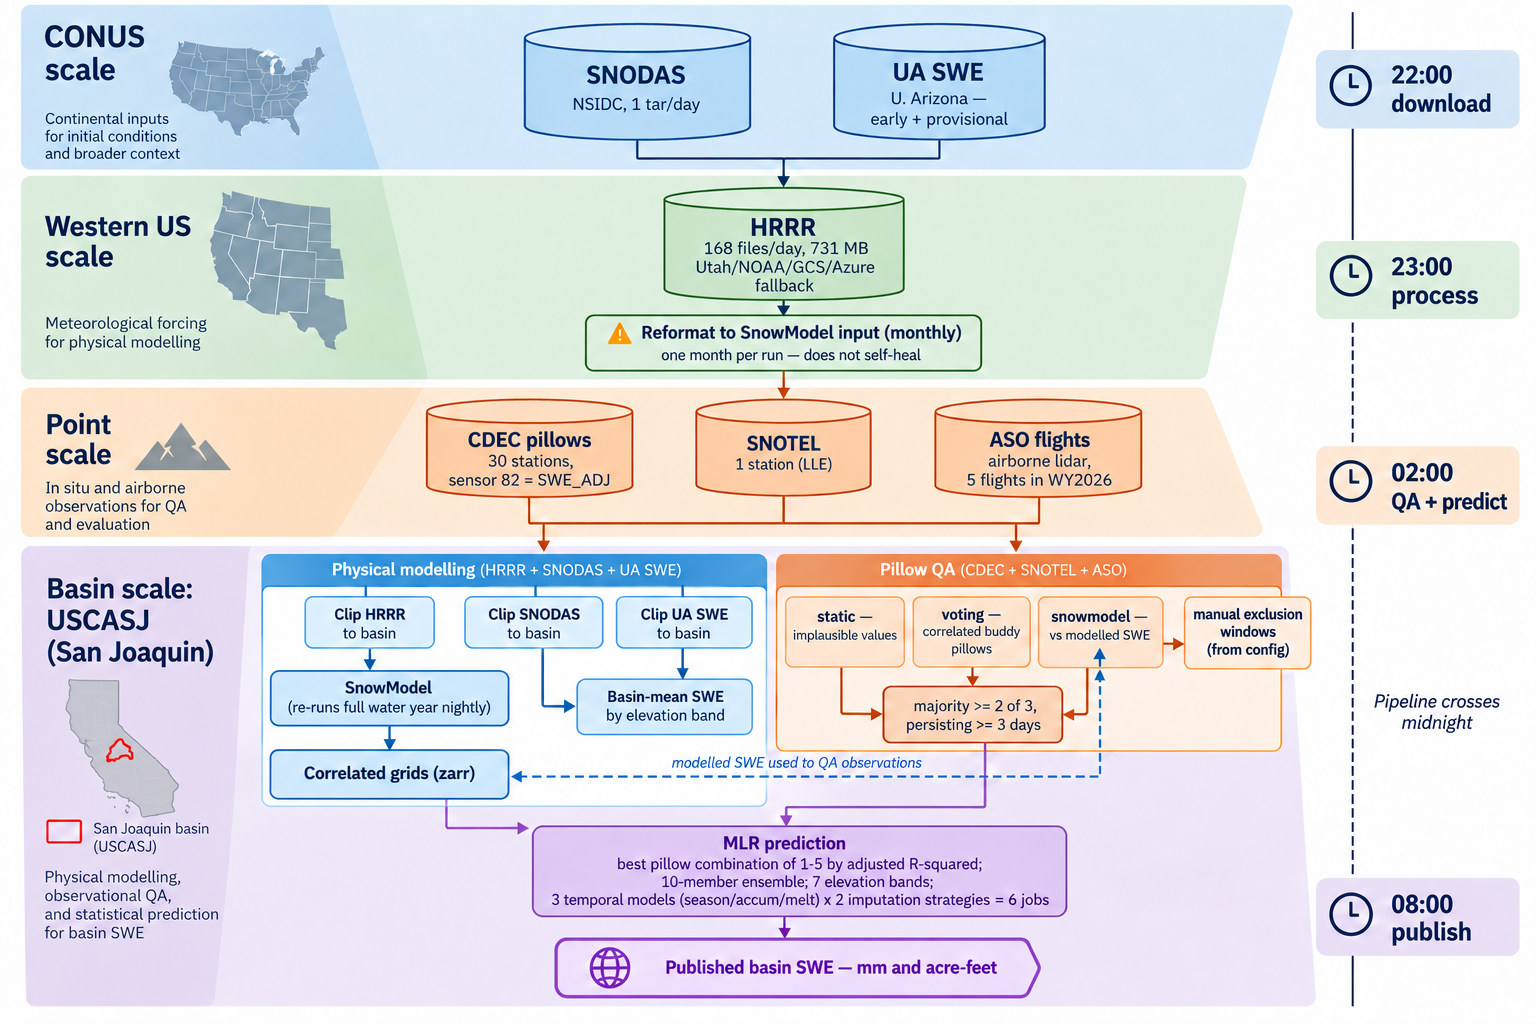
Overview
The Snow-Ops MLR system combines continental and regional gridded products, in situ snow-pillow observations, airborne snow observations, and physical snow modelling to produce daily basin-scale SWE predictions. The San Joaquin basin (USCASJ) is shown here as the worked example.
Two processing paths operate in parallel: physical modelling and observational quality assurance. These paths converge in the multiple linear regression (MLR) prediction. Modelled SWE is also used as one of the methods for quality-controlling snow-pillow observations.
Input data and scale funnel
Data enter the system at continental, western-U.S., point, and basin scales. The gridded products are clipped to the target basin and ultimately summarized into seven elevation bands for prediction.
| Scale | Dataset | Role / source |
|---|---|---|
| CONUS | SNODAS | NSIDC snow data; one archive per day |
| CONUS | UA SWE | University of Arizona early and provisional SWE products |
| Western U.S. | HRRR | Meteorological forcing for physical modelling; 168 files/day (~731 MB) |
| Point | CDEC pillows | In situ SWE observations; 30 stations in the San Joaquin workflow |
| Point | SNOTEL | Additional in situ SWE observation |
| Basin | ASO flights | Airborne lidar SWE observations used for model training and evaluation |
Nightly processing chain
The operational chain spans midnight. Distributed products are downloaded first, followed by basin processing, pillow QA and prediction, and publication the following morning.
| Time | Stage | Main operations |
|---|---|---|
| 22:00 | Download distributed products | Download HRRR, SNODAS, and UA SWE and reformat HRRR for SnowModel. |
| 23:00 | Basin process | Download in situ data, clip distributed products to the basin, run SnowModel, and calculate basin/elevation-band SWE products. |
| 02:00 | Pillow QA + prediction | Quality-control pillow observations and run the six MLR prediction variants. |
| 08:00 | Publish | Prepare prediction outputs and publish the basin web products. |
Snow-pillow quality assurance
Each pillow-day is evaluated using three independent automated QA methods plus a manually configured exclusion mask. Manual exclusions are applied before constructing the automated buddy comparisons.
| Method | Purpose |
|---|---|
static |
Flags physically implausible SWE values and changes. |
voting |
Compares a station against historically correlated snow pillows. |
snowmodel |
Compares observed SWE against SnowModel SWE at correlated grid cells. |
An observation is masked when at least two of the three automated methods flag it and that majority persists for at least three consecutive days. The resulting QA-controlled pillow dataset is then supplied to the prediction system.
MLR prediction
The MLR models are trained using the historical pillow record (WY1980–2025) paired with ASO observations from 35 flights during 2017–2025. Models are fit separately by elevation band.
Candidate pillow combinations containing one through five stations are evaluated against the ASO record, with the best combination selected using adjusted R-squared. The prediction workflow also retains the next-best combinations as an ensemble to characterize prediction spread.
Six prediction jobs are run each night: three temporal models (season, accumulation, and melt) crossed with two missing-data imputation strategies. Missing pillow values are filled either from other pillows or from SnowModel grid cells correlated with the missing station.
Published output
The final product is daily basin SWE summarized by elevation band and reported in both millimeters of SWE and acre-feet. Prediction ensembles provide a range associated with alternative high-performing pillow combinations.